Software does not run in the air. It lives on chips, moves across networks, and wakes data centers that sip or gulp electricity depending on how you design and operate it. If you build or run software, you can cut energy use and lower emissions without slowing down your roadmap. The key is to measure in the right places and turn those numbers into daily decisions your team can actually take.
This article is a practical guide for developers, data scientists, SREs, and product managers who want to make measurable progress on greener software. You will learn what to measure, how to measure it on devices and in the cloud, and how to act on the results. No hand‑waving, just steps, tools, and habits that fit into normal delivery cadence.
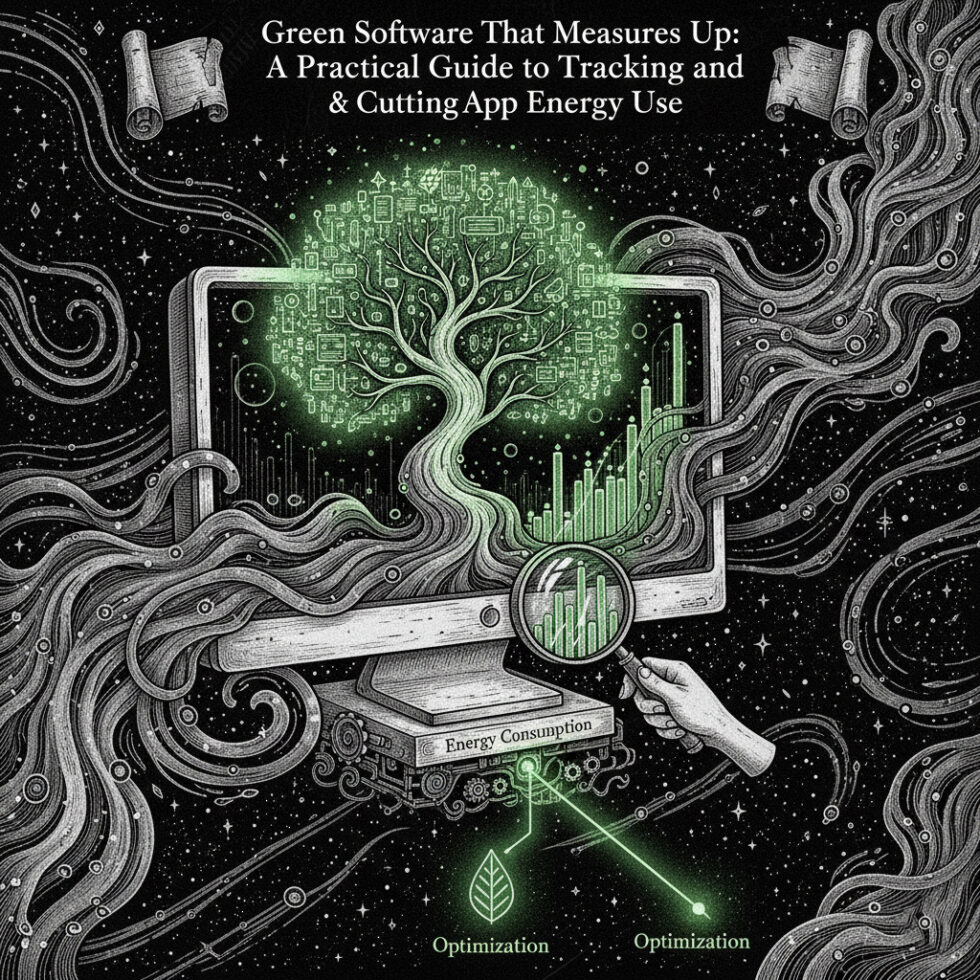
Why measure at all? Because what you don’t measure, you can’t improve
There are two good reasons to get specific about energy and emissions: engineering control and credibility. Teams that track what their code and infrastructure consume find performance bottlenecks they missed, save money on compute, and can show clear carbon reductions backed by data. It also keeps everyone honest. Claims like “we run on 100% renewable energy” are easy to write but hard to verify without a consistent method.
The simple math you need
At the core, you’re following two numbers:
- Energy: time × power, typically in watt‑hours (Wh) or kilowatt‑hours (kWh)
- Emissions: energy × grid carbon intensity (kgCO₂e per kWh)
Power tells you how fast you draw energy; grid carbon intensity tells you how “clean” the electricity is in that moment and place. If you reduce either, your total falls. If you can’t measure power directly, you can still estimate it with models. If you can measure directly, even better.
Define your boundary before chasing numbers
Decide what you include. The three common scopes for software teams are:
- Device: energy used by client devices (phones, laptops) running your app
- Network: energy used by data transfer across the internet and your CDN
- Cloud/data center: energy used by your servers, databases, and storage
You don’t have to do everything at once. Pick a slice you can influence and add more later.
The on‑device playbook: capture energy where code runs
When your software runs on user devices, saving energy also makes your app feel better. Less battery drain means fewer complaints and better retention. Even for server‑heavy products, profiling energy on development machines can reveal surprisingly expensive steps.
Measure on laptops and servers
- CPU and memory: On Intel systems, the Linux powercap interface exposes RAPL (Running Average Power Limit) counters. You can read energy for CPU packages and DRAM to get actual joules used during a benchmark run.
- GPU: Use nvidia‑smi to gather per‑process power draw and utilization. On AMD, use rocm-smi. Capture power at one‑second intervals during a workload to pair with throughput.
- System‑wide: Tools like Scaphandre (Linux) and Kepler (Kubernetes cluster add‑on) estimate or read power at process/container levels, which is ideal for CI pipelines and microservices.
Start simple: wrap a repeatable test scenario (e.g., a representative API call storm, a video render, or a model inference) and measure power before, during, and after. Aim for stable runs of at least 60 seconds to avoid noise. Record energy and latency together.
Measure on mobile
- Android: Battery Historian turns system traces into power usage insights. Combine with on‑device profiling to see which methods and wake locks drive drain.
- iOS: Xcode’s Instruments has an Energy Log template that flags hotspots such as high CPU wakeups, excessive networking, and animation impact on the render pipeline.
Mobile optimizations often pay back fast: squash unnecessary background jobs, reduce network round‑trips, and pin heavy work to charging or Wi‑Fi states when you can.
What to log from these tests
- Energy (Wh or J) per scenario
- Performance (latency, fps, throughput) for context
- Version of the app and flags/settings used
- Environment (hardware model, OS, drivers)
Save these side‑by‑side with your normal performance metrics. Treat energy as a first‑class regression target: changes that spike energy at the same throughput are bugs.
Cloud and data center: follow compute and choose cleaner regions
In the cloud, you rarely see a watt‑meter, but you can access two useful layers: provider reports and open‑source estimators. The combination gives you both where emissions occur and what to do about them.
Use provider tools for official numbers
- AWS: The Customer Carbon Footprint Tool shows emissions by service and region, based on your usage.
- Azure: The Emissions Impact Dashboard reports your organization’s cloud emissions and trends.
- Google Cloud: Carbon Footprint displays emissions by project and region, plus grid mix details.
These dashboards are great for leadership views and setting targets. They’re less granular than engineers want, but they anchor your totals and validate big moves like region changes.
Estimate at engineering resolution
Open tools help you assign estimated energy to specific workloads so you can experiment and compare:
- Cloud Carbon Footprint: Open‑source estimator that ingests your cloud billing/usage data to model energy and emissions by service.
- Kepler: A Kubernetes exporter that estimates power per pod using hardware counters, useful for containerized apps and batch jobs.
- Scaphandre: Agent to read power data on Linux nodes and attribute it to processes/containers.
Use them to test hypotheses: does downsizing a node pool and adding autoscaling cut energy without hurting latency? Do ARM instances deliver the same throughput at lower watts? Treat it like performance tuning, because it is.
Pick regions with cleaner electricity
Not all cloud regions are equal. Some are powered by grids with lower carbon intensity. Others have better renewable matching. If your users allow it (latency budget, data residency), moving stateless workloads to cleaner regions can reduce emissions immediately. Make your routing rules carbon‑aware so they prefer low‑intensity regions when performance allows.
Networks and the web: bytes are energy
Every byte you send or store takes energy across routers, switches, and disks. The web is fertile ground for efficiency gains that also improve speed.
Reduce data transfer without hurting quality
- Images: Serve modern formats (AVIF, WebP), use responsive sizes, and lazy‑load below‑the‑fold assets.
- Video: Choose efficient codecs (AV1, HEVC where supported), use per‑title encoding, and cap default bitrates to match typical viewing conditions.
- Fonts and JS: Subset, compress, and only ship what’s used.
- Caching: Aggressive HTTP caching and CDN edge caching reduce duplicate transfers.
Measure with tools you already trust (Lighthouse, WebPageTest). Then estimate the energy impact with web‑oriented models that map transferred data to kWh based on infrastructure assumptions. Combine page‑weight savings with CDN analytics to get total byte reductions at the monthly scale.
Use greener edges when possible
Some CDNs publish sustainability data and offer greener options. For compute at the edge, check if your provider offers data centers with better renewable matching and route traffic to those points for compute‑heavy workers when latency allows.
Carbon‑aware scheduling: time matters as much as place
Grid carbon intensity changes every hour with weather and demand. When you run workloads can matter nearly as much as where. That’s great news for batch jobs, builds, ML training, and other flexible tasks.
Get a live signal
- ElectricityMap: Real‑time and forecasted carbon intensity by region.
- WattTime: Marginal emissions data and forecasts, useful for deciding when running one more server does more or less climate harm.
- Carbon Aware SDK: An open SDK that wraps multiple carbon‑intensity data sources and helps choose cleaner times or regions.
With these, you can delay or advance a job by a couple of hours to run during a cleaner window. In many places this makes a meaningful difference without user impact.
Wire it into your platform
- CI/CD: Gate non‑urgent jobs (nightly tests, container builds) if the carbon signal is “dirty,” and trigger when it improves.
- Kubernetes: Use event‑driven autoscaling to pick up queues when intensity drops; scale to zero during persistently dirty stretches if latency allows. Add a cluster service that checks the carbon API and sets a flag your jobs respect.
- Batch schedulers: For data pipelines, add a carbon‑aware policy that shifts windowed jobs within SLAs.
Keep user‑facing flows fast and predictable, but make everything else flexible. Many teams find they can shift 20–40% of compute without business risk.
AI and data workloads: the big levers
Training and serving AI models can be among the most energy‑intensive tasks you run. The same principles apply—measure, then change hardware, code, and timing—but there are extra levers.
Measure properly before optimizations
- GPU power: Log per‑device power and utilization via vendors’ tools during training and inference. Sample at a steady cadence.
- Trace tokens and FLOPs: Track tokens per request and model FLOPs to normalize energy per unit of useful work (e.g., Wh per million tokens).
- Use a library: Tools like CodeCarbon attach to popular ML frameworks and record energy and emissions across runs so you can compare experiments.
Training changes that cut energy
- Mixed precision: Move to FP16/BF16 when possible. Less data moved and computed means lower energy per step.
- Efficient architectures: Smaller models or distilled models can reach the same task accuracy with far less compute.
- Data curation: Cleaner, deduplicated datasets reduce epochs and shorten training time.
- Carbon‑aware windows: Start long training runs when and where the grid is cleanest.
Serving changes that cut energy
- Right‑size: Use the smallest accelerator that meets your latency SLO.
- Batching and caching: Batch inferences when possible; cache frequent prompts/outputs.
- Distillation and quantization: Smaller, quantized models often match user‑visible quality at a fraction of energy.
- Retrieval choices: Tune your retrieval to reduce token counts without harming relevance. Fewer tokens in, fewer tokens out.
Always pair energy with quality metrics. The win is lower Wh per unit of useful work, not just lower watts.
Build measurement into CI/CD and daily work
Don’t make energy tracking a side project. If it lives where you already test and deploy, it has a future.
Add an energy budget to performance tests
Extend your existing benchmarks with power/energy capture. Store results alongside latency and throughput. When a PR increases energy per request beyond a set threshold at the same throughput, fail the check and open a task to fix it. Keep initial thresholds forgiving and tighten them as you build confidence.
Use cluster‑level agents
For microservices, run a power estimation exporter on each node and push metrics to your existing observability stack. Create a dashboard of energy per service and per Kubernetes namespace. Tag deployments by version to see regressions.
Track web page weight as a proxy
If you own a web frontend, set budgets for total bytes, number of requests, and CPU time on the main thread. Use build‑time checks and performance monitoring in production to keep regressions out. Then convert byte savings into energy/emissions estimates with a standard model to show progress.
A role‑by‑role playbook you can start using
Frontend developers
- Set page‑weight budgets and automate checks in CI.
- Switch to AVIF/WebP and responsive images.
- Trim JavaScript bundles; defer non‑critical work.
- Measure with Lighthouse and WebPageTest; tie byte savings to energy estimates.
Backend developers
- Find hot queries; reduce N+1 calls and add indexes.
- Right‑size instances; avoid over‑provisioning.
- Use async and event‑driven patterns to batch work.
- Expose idempotent endpoints so clients don’t retry unnecessarily.
Mobile developers
- Profile with Battery Historian (Android) or Energy Log (iOS).
- Reduce background wakeups and network chatter.
- Prefetch on Wi‑Fi and charge when possible.
- Smooth animations; avoid unnecessary recompositions.
Data/ML engineers
- Instrument with CodeCarbon and GPU power logs.
- Adopt mixed precision and distillation.
- Schedule training when carbon intensity is low.
- Cache common inferences; reduce token counts.
Platform/SRE
- Deploy Kepler or Scaphandre in clusters.
- Implement scale‑to‑zero for idle services.
- Route stateless traffic to cleaner regions when latency allows.
- Add a carbon signal to your scheduler for batch workloads.
Product managers
- Include a greener software KPI (e.g., Wh per user action) on the dashboard.
- Prioritize features that cut bytes or compute with user‑visible speed wins.
- Set quarterly targets and celebrate energy regressions fixed like performance wins.
Avoid common traps
Trap 1: “100% renewable” means zero emissions
Many providers match annual consumption with renewable certificates, but the grid’s real‑time carbon intensity still varies. If you care about operational reductions, use location‑based or marginal intensity to drive decisions. Keep market‑based numbers for reporting, but don’t stop there.
Trap 2: Over‑indexing on estimates or on precision
Models are helpful when you lack direct measurements, but they hide local effects. Hardware counters are great, but don’t stall improvements waiting for perfect meters everywhere. Use the best available data at each layer and iterate.
Trap 3: Pure totals without normalizing for value
Track energy per unit of work (e.g., Wh per request, Wh per million tokens, Wh per minute of video processed). If your product grows, totals will grow too; intensity tells you whether the product is getting greener as it scales.
Trap 4: Rebound and performance trade‑offs
Sometimes a change saves energy per unit but increases total usage by making things cheaper or faster. That’s okay—just measure both. Keep user experience at the center and make transparent choices.
A 30‑day plan to get your first results
Week 1: Pick scope and baseline
- Choose one user flow or one service to measure.
- Set up measurement: install Scaphandre/Kepler on a dev/staging node, enable GPU logs, or set up mobile energy profiling.
- Run a repeatable test; log energy and performance.
Week 2: Cut the obvious waste
- Trim bytes, fix hot queries, right‑size instances, remove polling loops.
- Re‑run tests to confirm energy drops at equal or better performance.
Week 3: Add carbon awareness
- Integrate a carbon‑intensity API (ElectricityMap or WattTime).
- Make one batch process or nightly CI job defer to cleaner windows.
- Document the change and results.
Week 4: Report and institutionalize
- Create a dashboard tile: “Energy per request” and “Carbon per deploy.”
- Add a PR check for energy regression on your benchmark.
- Share a one‑pager with before/after, methods, and next candidates.
From here, expand scope: more services, web frontends, and region routing. Keep the cycle going: measure, improve, and lock in gains through automation.
Frequently asked questions
Isn’t this just performance tuning with a new label?
Partly, and that’s a feature. Many energy wins come from the same practices that improve speed and cost: fewer bytes, fewer instructions, smarter scheduling. The difference is using a carbon signal for timing and setting energy budgets alongside latency.
How accurate are the numbers?
Direct hardware counters can be quite accurate for relative comparisons in a stable environment. Cloud estimates are coarse but directionally useful, especially when comparing regions or instance types. The goal is not perfect accuracy; it’s consistent measurement that drives better decisions.
Will users notice?
Done right, they’ll notice faster loads, longer battery life, and fewer hiccups. Carbon‑aware scheduling targets non‑user‑facing work by default. For real‑time flows, route to cleaner regions only when it does not violate latency SLOs.
Toolbox: a quick reference
- Device/Node: Linux powercap (RAPL), nvidia‑smi, rocm‑smi, Scaphandre
- Cluster: Kepler exporter for Kubernetes
- Cloud: Cloud Carbon Footprint; provider dashboards (AWS/Azure/GCP)
- Web: Lighthouse, WebPageTest; image/video optimizers
- Carbon signals: ElectricityMap, WattTime, Carbon Aware SDK
- ML: CodeCarbon; framework‑level mixed precision
Culture: make greener software part of Definition of Done
The biggest lever is consistency. Add an energy or carbon acceptance criterion where it makes sense—not everywhere, but where you already track performance. Treat regressions like any other quality issue. Share wins in release notes. Once your team sees that greener usually means faster and cheaper, momentum builds on its own.
Summary:
- Measure energy in the places you control: devices, servers, and clusters, and pair it with performance
- Use provider dashboards for totals and open tools for engineering‑level estimates
- Reduce bytes on the web; optimize images, video, JS, and caching
- Adopt carbon‑aware scheduling to shift flexible workloads to cleaner times and regions
- For AI workloads, log GPU power, switch to mixed precision, distill or quantize, and cache
- Add energy budgets to CI, treat regressions like performance bugs, and celebrate fixes
- Avoid common traps: don’t rely solely on “100% renewable” claims, normalize per unit of work, and balance precision with progress
- Start with a 30‑day plan: baseline, quick wins, carbon‑aware scheduling, then institutionalize
External References:
- Cloud Carbon Footprint (open-source)
- Scaphandre: Power metering agent for Linux
- Linux Powercap framework (RAPL interface)
- NVIDIA System Management Interface (nvidia‑smi)
- Android Battery Historian
- Sustainable Web Design (methods and models)
- The Green Web Foundation: CO2.js
- Lighthouse performance audits
- ElectricityMap: Live and forecasted grid carbon intensity
- WattTime: Marginal emissions and forecasts
- Carbon Aware SDK
- Google Cloud Carbon Footprint
- CodeCarbon: Track emissions from ML code